Sources & credits
Research records and image credits for this website.
Academic and project information is drawn from the linked research records, project websites, and my professional profile. The project overview was updated in November 2026.
- University of Jena — current acting role in remote sensing
- University of Tübingen — Michael Schultz’s research profile and portrait
- Wageningen University — doctoral thesis, 2018
- University of Tübingen — Geoinformatics publications
- Schultz et al. — OSMlanduse, Scientific Data, 2025
- ORCID — Michael Schultz
- OSMlanduse code repository
- OSM Landuse Landcover — interactive map, project leads, methods, and Heidelberg / HeiGIT team credits (Info & Contact)
- Flood Risk Adaptation Measures and Evaluation (FRAME) — main portal · Vietnamese portal · DLR — official platform name
- FloodAdaptVN — project, BMFTR / SURE funding and implementation period
- DLR — FRAME chapter and complete author list
- Land-monitoring research atlas for Supporting Ukraine in the implementation of the Paris Agreement and adaptation to the impact of climate change in the Black Sea region (PAABS) · GIZ programme overview · Official full project name and International Climate Initiative (IKI) funding
- My LinkedIn profile — Ukraine project contribution
- Trade Fluidity & Border Monitoring — Border Observatory historical observation viewer
- World Bank — Reimagining Logistics and Connectivity from Space: Artificial Intelligence and Satellite Imagery Applications, reproducibility package
- Avitabile et al. (2016) — Carbon emissions from land cover change in Central Vietnam
- Schultz et al. (2016) — Performance of vegetation indices from Landsat time series in deforestation monitoring
- Avitabile et al. (2017) — Forest Change and REDD+ Strategies
- WWF / Österreichische Bundesforste — Xe Pian REDD+ project · WWF project factsheet
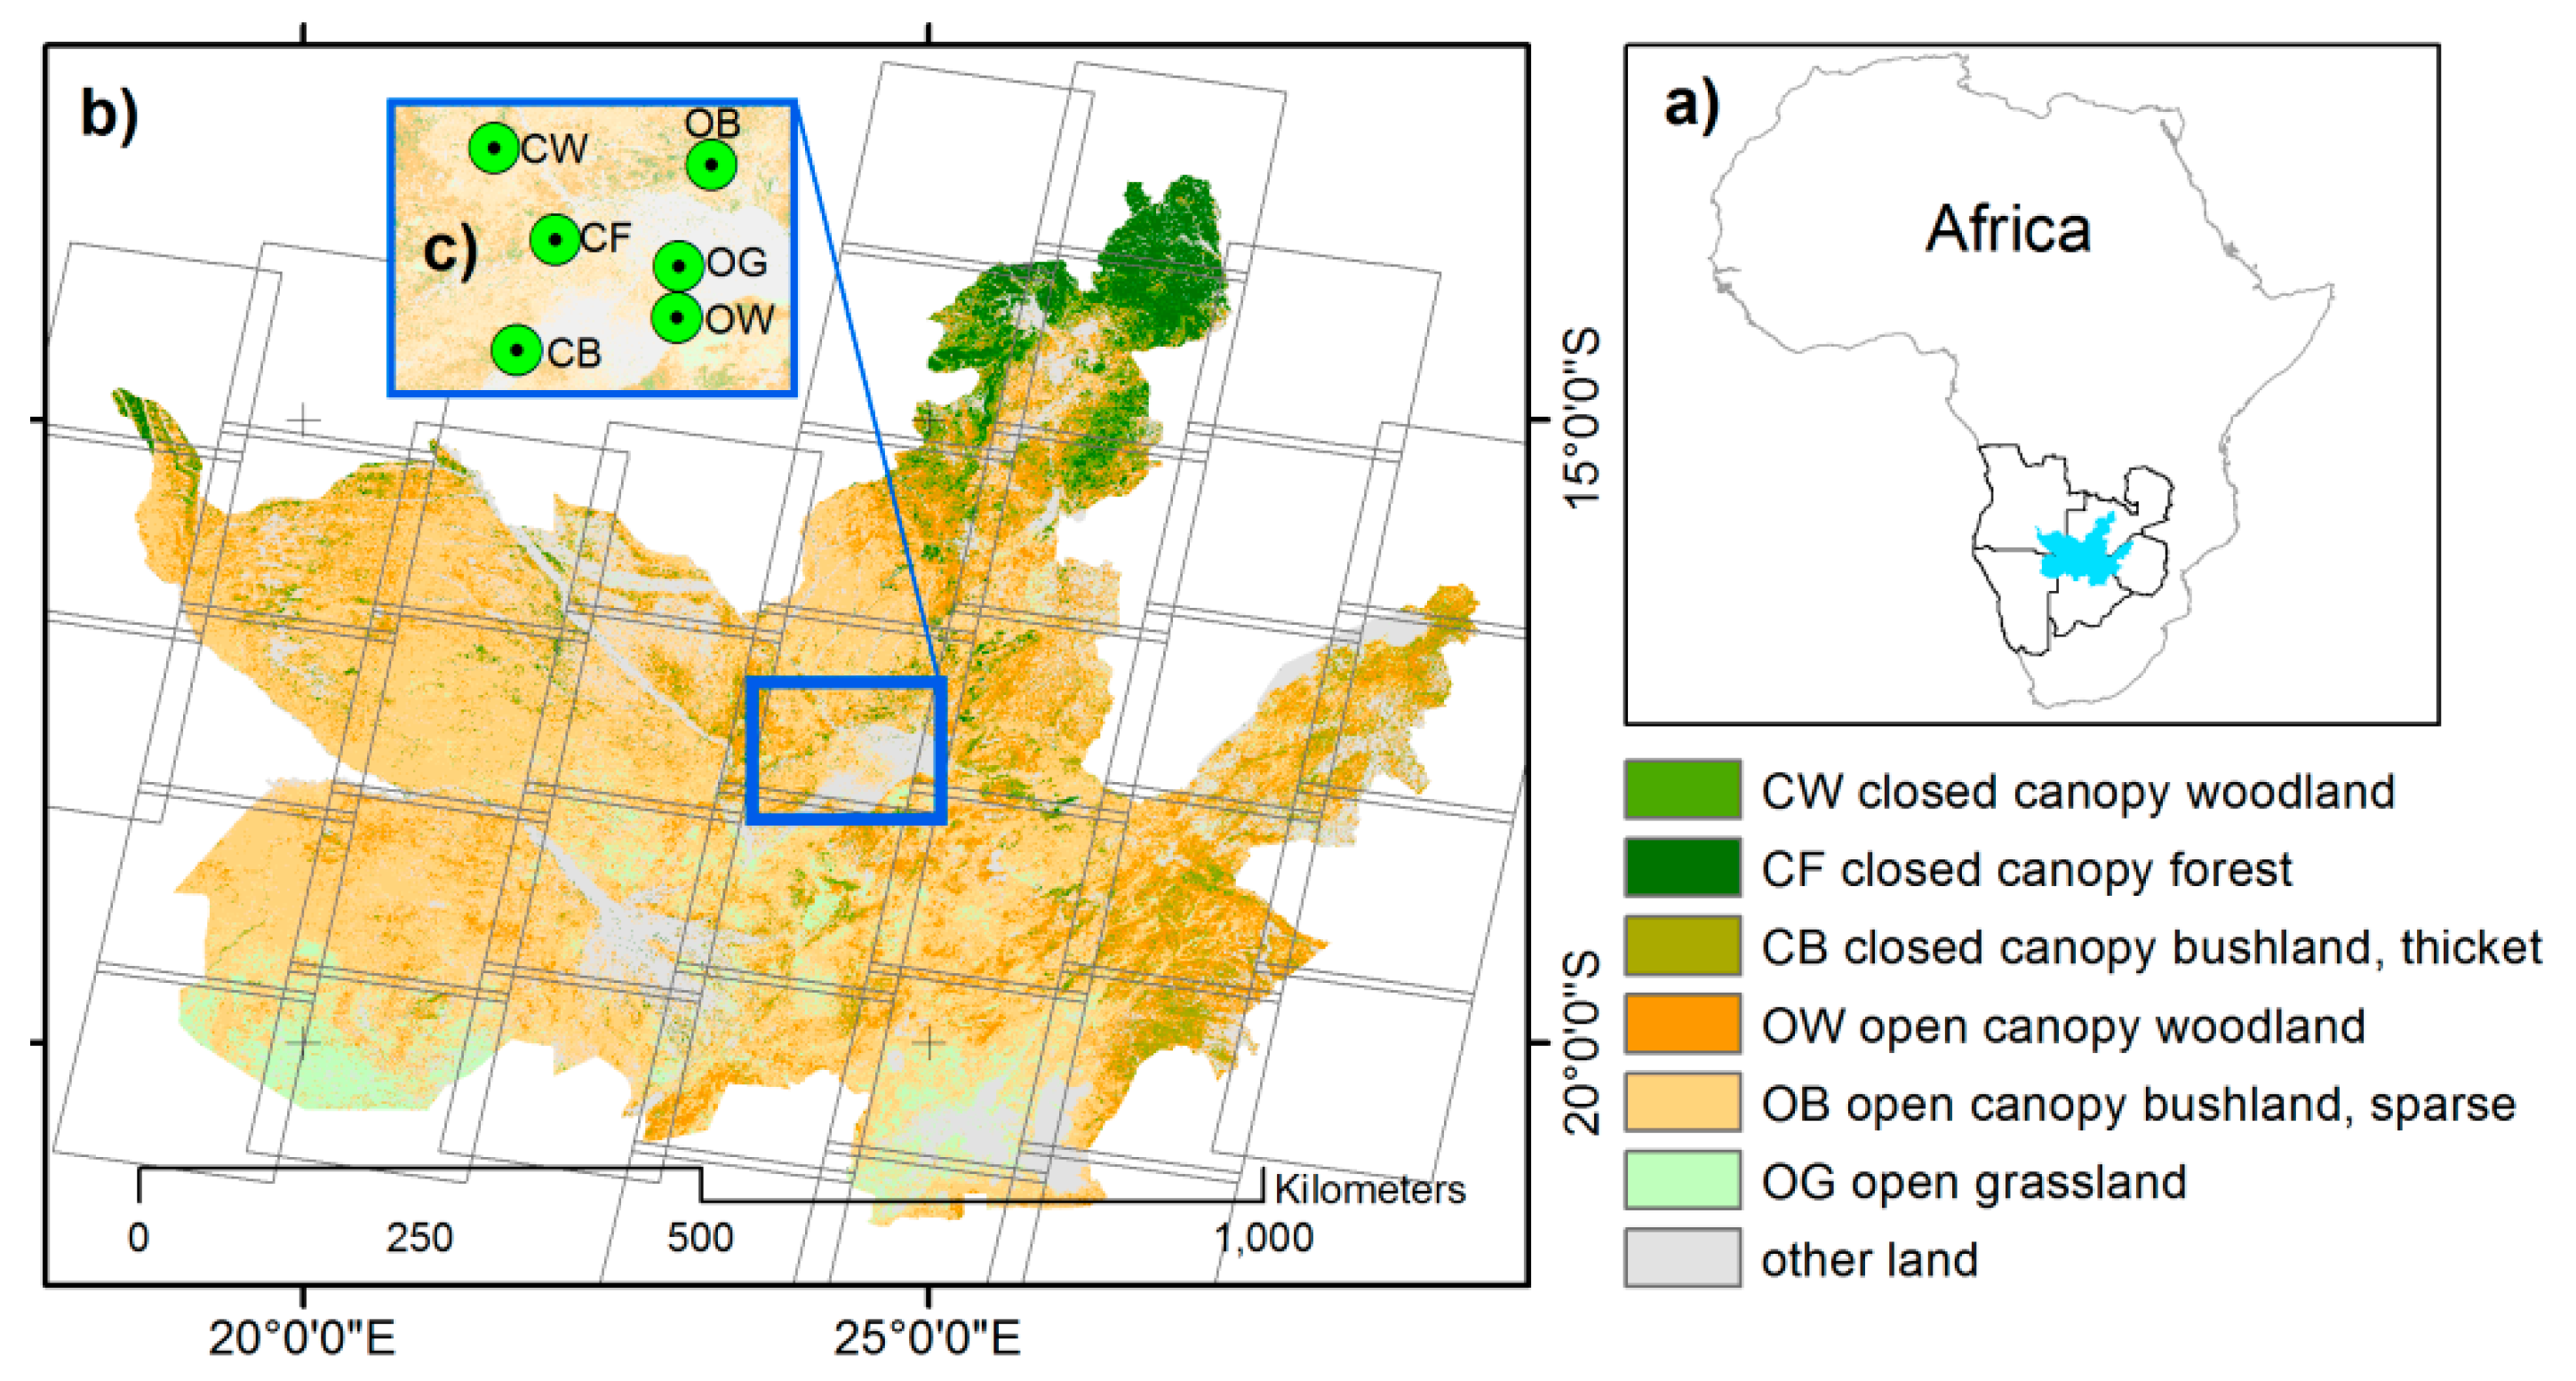
- WWF — KAZA land-cover mapping and monitoring · Schultz et al. (2018), research paper
- Ulrich et al. (2023) — Land-use carbon fluxes in Baden-Württemberg
- Street-level vehicle greenhouse-gas emissions in Berlin (2023)
Images
The portrait is sourced from the University of Tübingen’s institutional profile. The OSMlanduse figure is reproduced unchanged from the open-access publication. The scenario illustration comes from the FRAME / FloodAdaptVN platform. Homepage screenshots show the FRAME workspace, a 3D data overview of Chirundu in the Border Observatory, paabs.de, and OSM Landuse Landcover, captured in November 2026. OSMlanduse map data © OpenStreetMap contributors; cartography and platform credits are listed in the viewer’s Info & Contact section. The raised map shapes visualise satellite-derived observation data. Chirundu basemap © OpenStreetMap contributors.
Schultz et al. (2025), Fig. 2 · CC BY 4.0. Map data © OpenStreetMap contributors.
Past-work figures & experience
The Vietnam carbon map is Figure 2.5 in Michael Schultz’s doctoral thesis (2018), Chapter 2, from the study by Avitabile et al. (2016). The vegetation-index figures are the spider plots in Figure 4.7 and the bar plots in Figure 4.3, Chapter 4, from Schultz et al. (2016). The spider plots show relative performance ranks across six criteria; positions farther from the centre indicate better performance. These previews reproduce the figures without changing their data; surrounding thesis text is omitted.
The KAZA map is Figure 1 from Schultz et al. (2018), reused under CC BY 4.0 and resized proportionally. All previews link to their full-size figures or source studies.
Dates and responsibilities in the past-work overview follow my professional CV. Linked institutional project pages and publications provide the public research and project context.
Design inspiration
The site’s academic structure was inspired by Simon Besnard’s personal website. This implementation is an independent, lightweight static website.